IC Markets Home Sign in Web Trader Contact Us
IC Markets Social IC Markets Social

Information Hub for
Serious Traders

  • ABOUT US
  • OPEN LIVE ACCOUNT
  • OPEN DEMO ACCOUNT
  • TRADE NOW
  • VISIT OUR BLOG
IC Markets Social
  • ABOUT US
  • OPEN LIVE ACCOUNT
  • OPEN DEMO ACCOUNT
  • TRADE NOW
  • VISIT OUR BLOG
December 28, 2022North_American_Stocks_esIC Markets

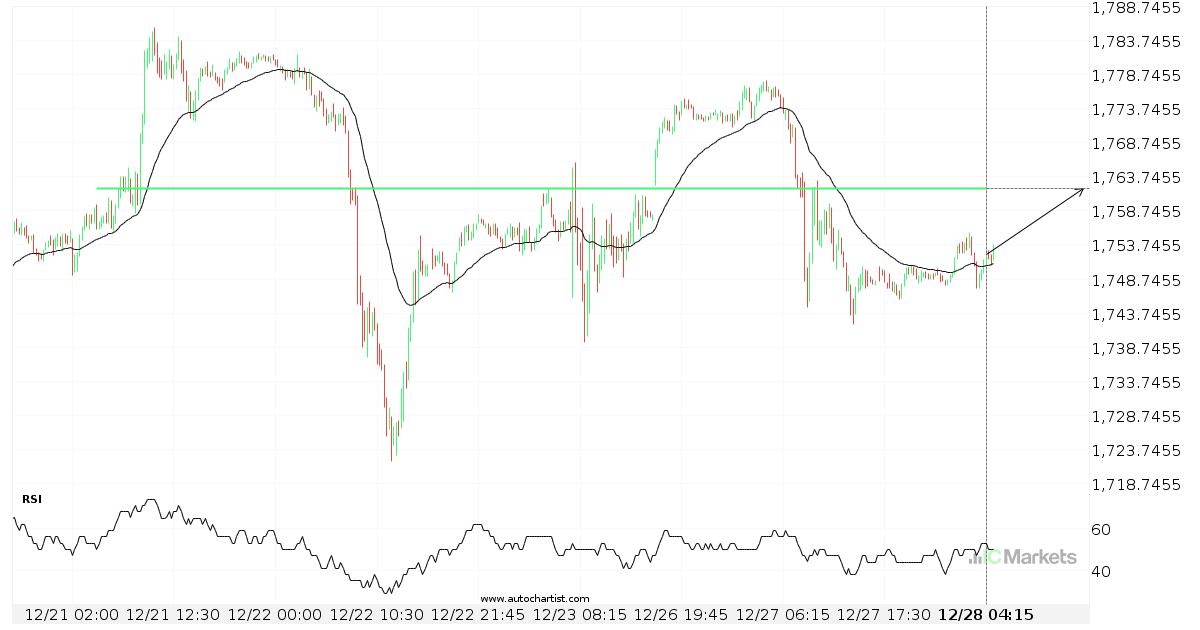
US Small Cap 2000 Index – se acerca a la línea de precio psicológico

El US Small Cap 2000 Index avanza hacia la línea de resistencia de un Resistencia. Como lo hemos observado retrocediendo desde este nivel en el pasado, podríamos observar, o bien una ruptura a través de esta línea o una recuperación de nuevo a los niveles actuales. Ya ha llegado a dicha línea en numerosas ocasiones […]

Read more
December 27, 2022North_American_Stocks_esIC Markets

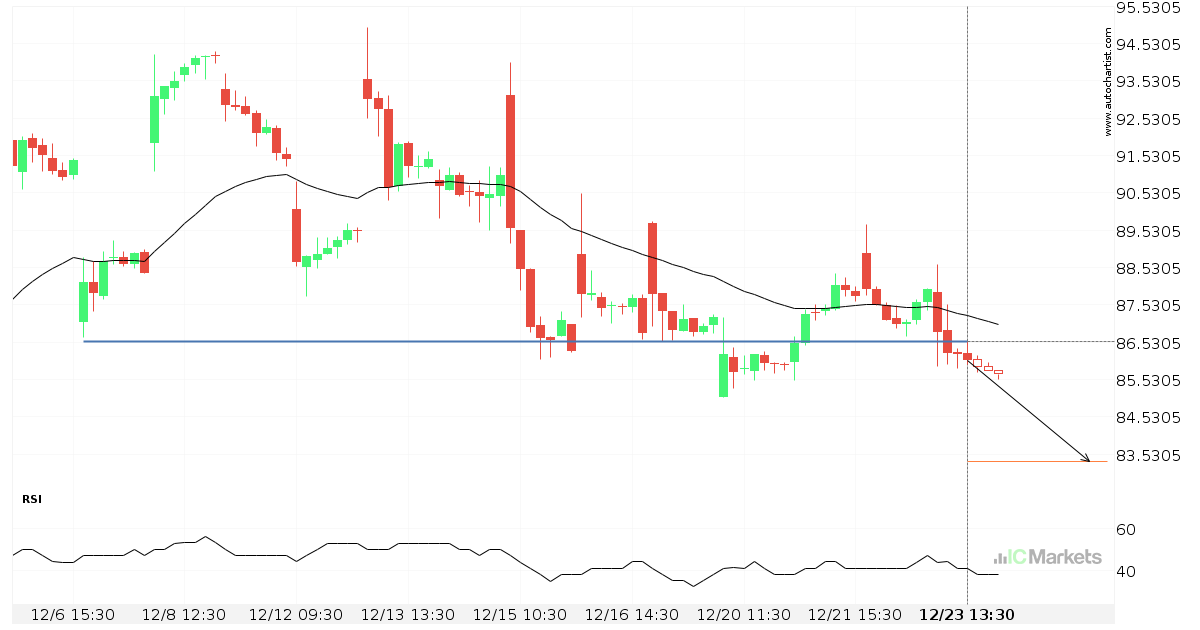
Alibaba Group Holding Limited – línea de precio psicológico atravesada

El Alibaba Group Holding Limited atravesó la línea de soporte. Como ya lo hemos visto retroceder desde esta posición en el pasado, deberíamos esperar la confirmación de la ruptura antes de operar. Ha llegado a esta línea en numerosas ocasiones en los últimos 17 días, lo cual sugiere un posible nivel objetivo alrededor de 83.3395 […]

Read more
December 26, 2022North_American_Stocks_esIC Markets

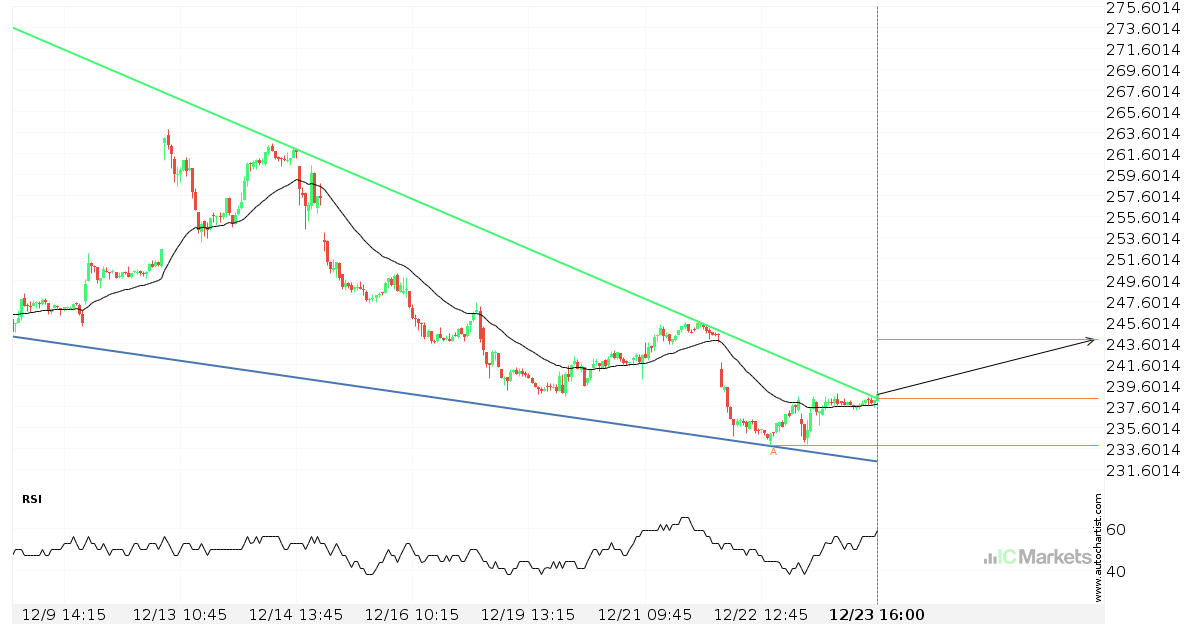
El Microsoft Corporation ha atravesado la resistencia

El Microsoft Corporation atravesó una línea de resistencia. Ha entrado en contacto con esta línea por lo menos dos veces en 16 días. Esta ruptura puede indicar un movimiento potencial a 243.9393 en 23 horas. Como ya vimos un retroceso de esta posición en el pasado, debemos esperar la confirmación de la ruptura antes de […]

Read more
December 23, 2022North_American_Stocks_esIC Markets

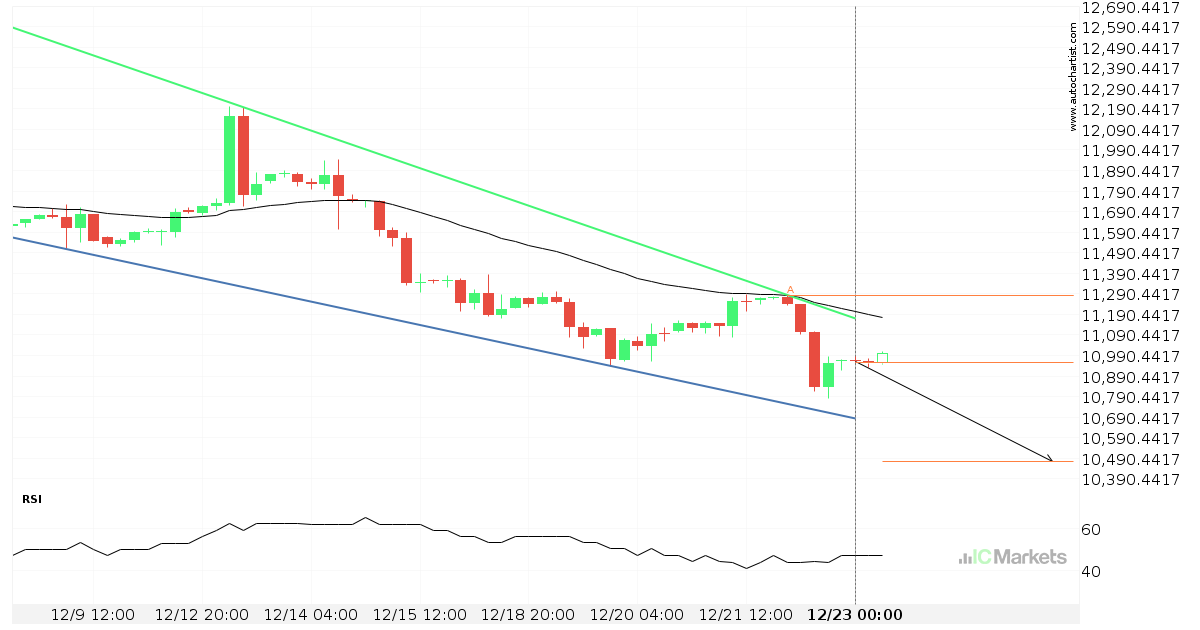
Posible ruptura del nivel de soporte en el US Tech 100 Index

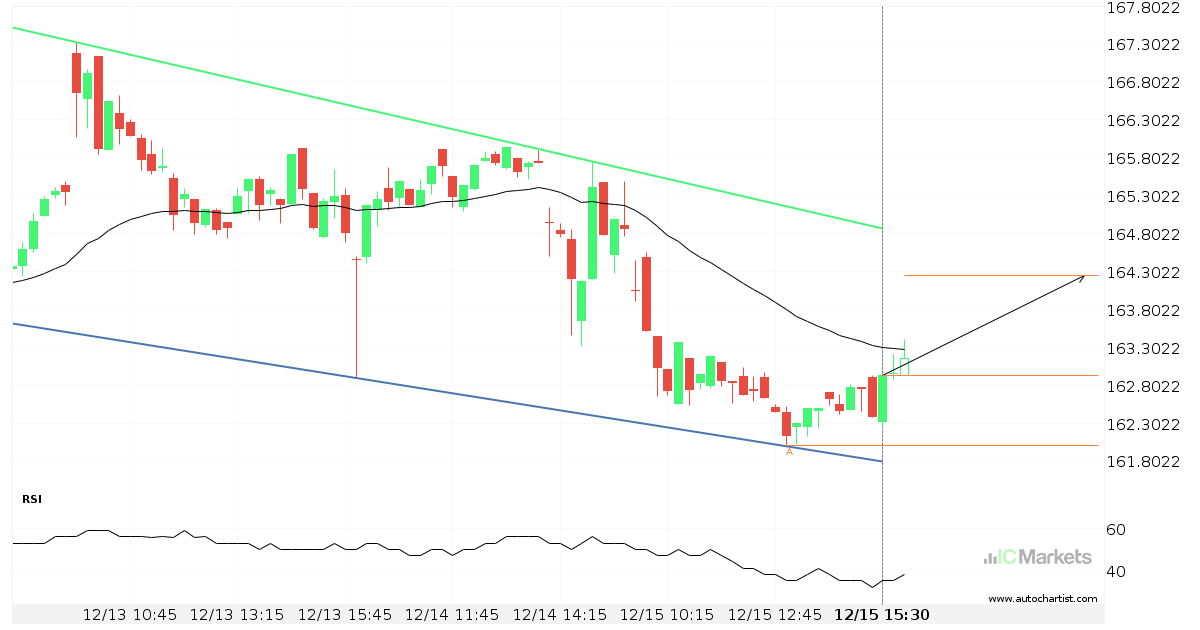
El US Tech 100 Index avanza hacia la línea de soporte de un Cuña descendente, que ya ha probado varias veces en el pasado. Hemos visto un retroceso antes desde esta línea, así que en esta etapa no está claro si atravesará esta línea o se recuperará como lo ha hecho anteriormente. Si el US […]

Read more
December 22, 2022North_American_Stocks_esIC Markets

El Tesla Inc. experimentó 8 velas consecutivas, bajistas 4 por hora

Para aquellos de ustedes que no creen en las tendencias, esta podría ser una oportunidad para aprovechar una excepcional cantidad de velas consecutivas bajistas en el Tesla Inc.. Este movimiento ha ocurrido en los últimos 6 días. Para aquellos de ustedes que siguen las tendencias, deberían considerar aprovecharse de la misma.

Read more
December 21, 2022North_American_Stocks_esIC Markets

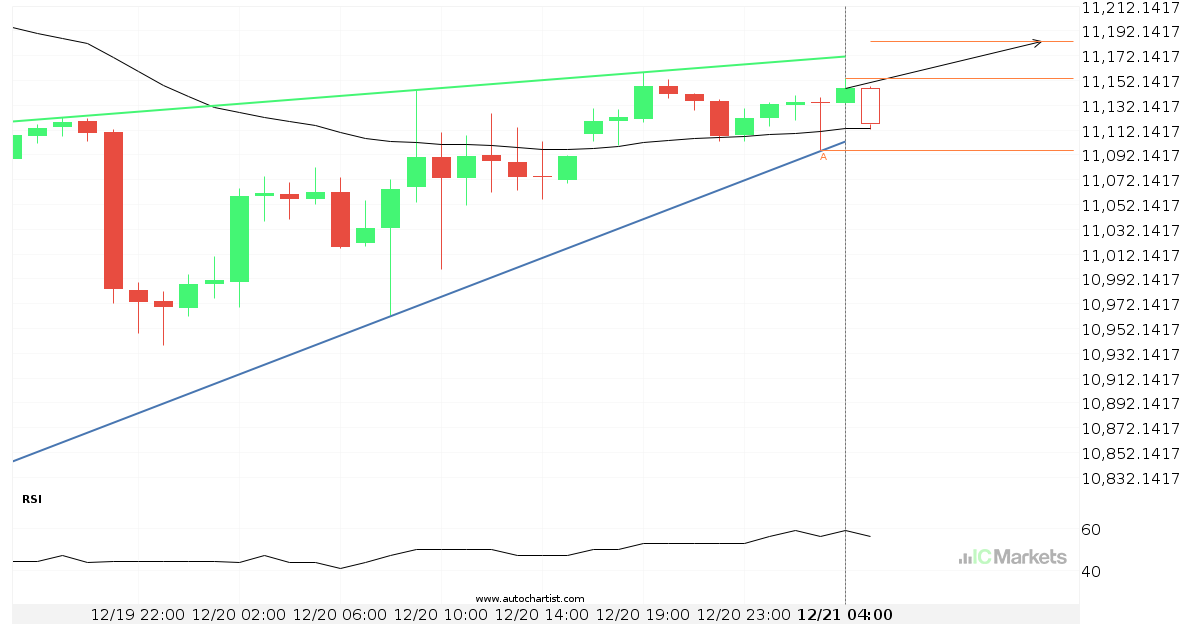
Posible ruptura del nivel de resistencia en el US Tech 100 Index

El US Tech 100 Index avanza hacia la línea de resistencia de un Cuña ascendente, que ya ha probado varias veces en el pasado. Hemos visto un retroceso antes desde esta línea, así que en esta etapa no está claro si atravesará esta línea o se recuperará como lo ha hecho anteriormente. Si el US […]

Read more
December 20, 2022North_American_Stocks_esIC Markets

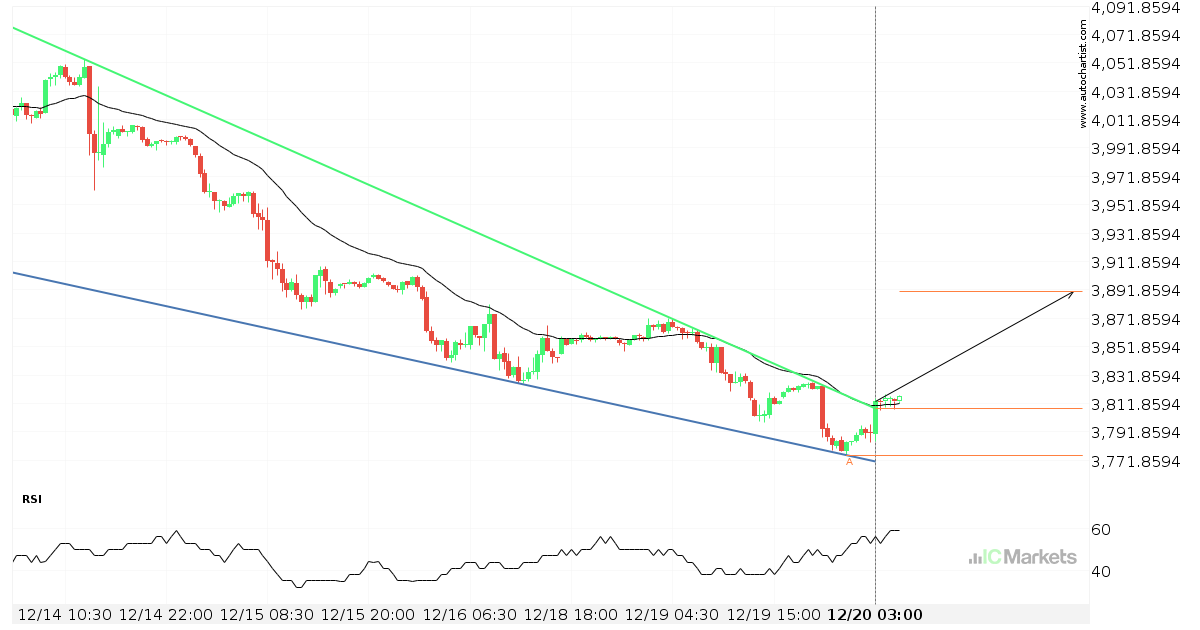
Se espera la posibilidad de un gran movimiento en el US SPX 500 Index

El US SPX 500 Index ha atravesado una línea de resistencia de un Cuña descendente y sugiere un movimiento posible a 3890.5974 dentro de las próximas 2 días. Ya ha probado esta línea en el pasado, por lo que deberíamos esperar la confirmación de esta irrupción antes de entrar en acción. Si dicha ruptura no […]

Read more
December 19, 2022North_American_Stocks_esIC Markets

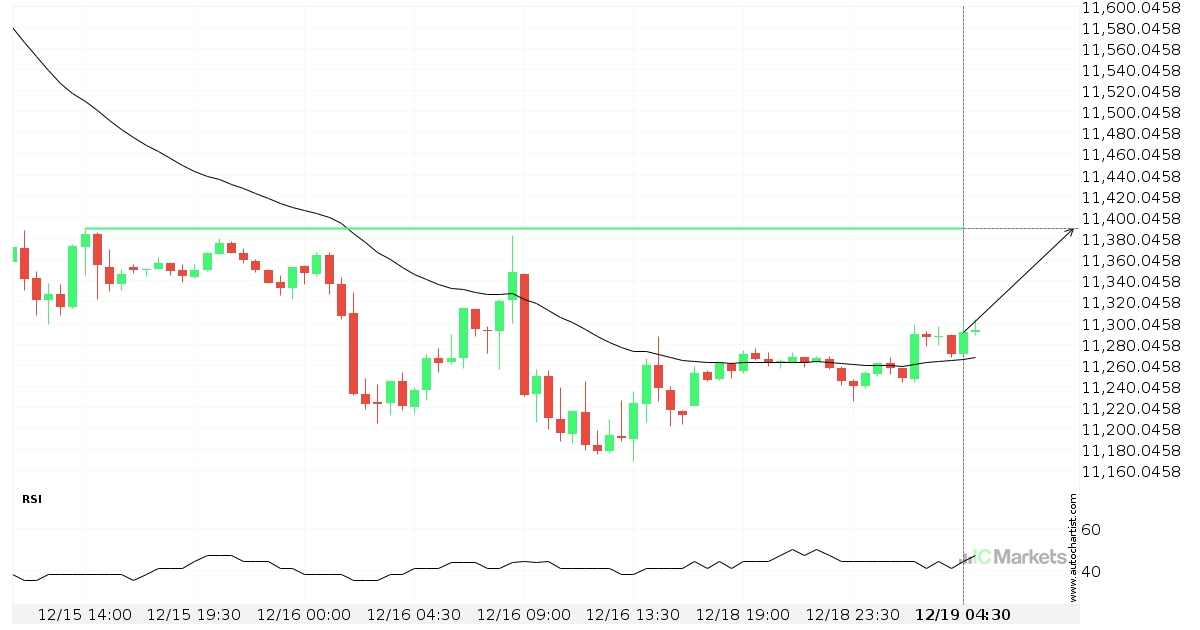
Inminente irrupción de una importante línea de precio del US Tech 100 Index

El US Tech 100 Index avanza hacia la línea de 11389.2998, que ya ha probado en numerosas ocasiones durante el pasado. Hemos observado un retroceso desde esta posición en el pasado, por lo que en esta fase no está claro si atravesará este precio o se recuperará como ya hizo antes. Si el US Tech […]

Read more
December 16, 2022North_American_Stocks_esIC Markets

El AbbVie se aproxima a la resistencia de un Canal bajista

El AbbVie se está acercando a la línea de resistencia de un Canal bajista. Ha llegado a esta línea en numerosas ocasiones durante los últimos 4 días. Si vuelve a probarla de nuevo, debería hacerlo en las próximas 5 horas.

Read more
December 15, 2022North_American_Stocks_esIC Markets

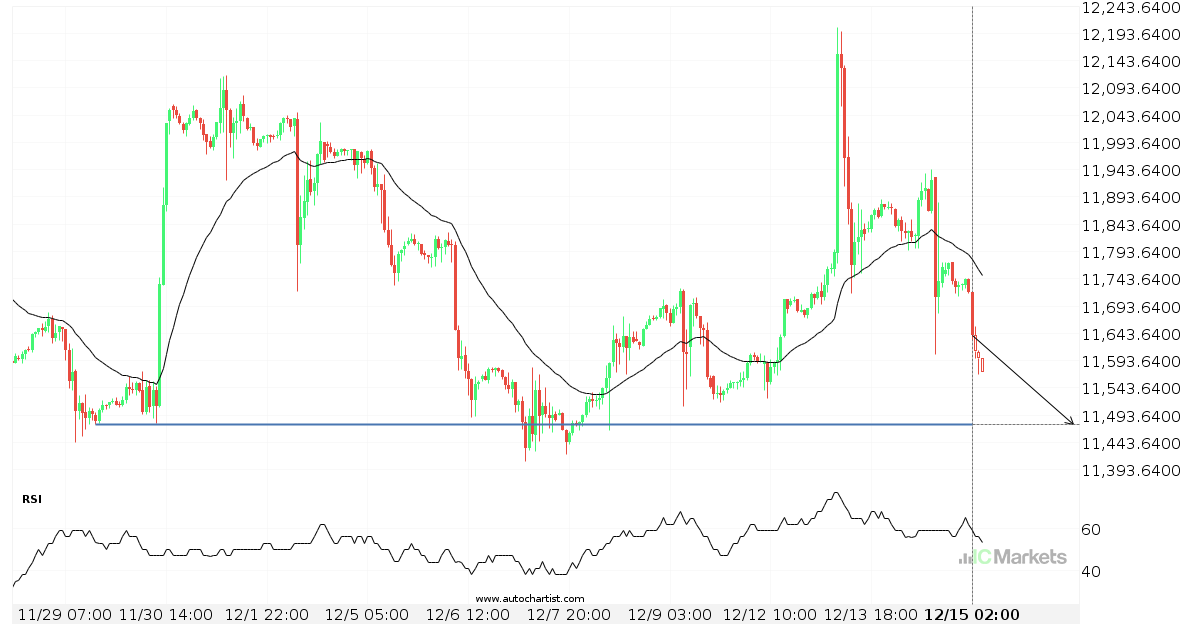
O bien, una inminente recuperación o una ruptura del US Tech 100 Index

El US Tech 100 Index avanza hacia la línea de 11475.9004. Si este movimiento se mantiene, el precio del US Tech 100 Index podría probar el nivel de 11475.9004 en un plazo de 3 días. Pero no se apresure a la hora de operar, porque el par ha probado esta línea en numerosas ocasiones durante […]

Read more
  • 1
  • 2
  • 3
  • …
  • 42
  • 43
  • 44
  • 45
  • 46
  • 47
  • 48
  • …
  • 89
  • 90
  • 91

Recent Posts

  • Either a rebound or a breakout imminent on SILVER
  • GOLD Nível visado: 2976.3601
  • A potential bearish movement on GOLD
  • มีโอกาสเกิดการเคลื่อนตัวแบบ bearish บน GOLD
  • Posible gran movimiento en el AUDJPY

Recent Comments

    Translation


     Edit Translation

    Trade with

    a market leader you can rely on

    Open Trading Account Try a Free Demo

    Forex Trading

    • Accounts Overview
    • Open an Account
    • Launch Web Trader

    Trading Specifications

    • Spreads and Commissions
    • Range of Market
    • Trading Hours
    • Funding
    • Withdrawal

    About IC Markets

    • Help Center
    • Why IC Markets
    • Regulation
    • Legal Documents
    • Contact Us


    Forex Trading

    • Accounts Overview
    • Open an Account
    • Launch Web Trader

    Trading Specifications

    • Spreads and Commissions
    • Range of Market
    • Trading Hours
    • Funding
    • Withdrawal

    About IC Markets

    • Chat with a Specialist 24/7
    • Why IC Markets
    • Regulation
    • Legal Documents
    • Contact Us

    Disclaimer: This material is marketing material where all marketing material is published for informational purposes only. This material does not contain and should not be considered as containing - investment advice and recommendations, or suggestions for performing any actions with financial instruments. The built-in widgets belong to their external independent authors, and IC Markets is not responsible for their content and their impact on trade.

    All content rights reserved. Opinions of the authors may not coincide with the opinion of the blog editors. When copying materials from this site or connecting to an RSS feed to republish our articles, a link to IC Markets or attribution in the format ‘IC Markets Blog’ is required. For general questions, please contact the editorial office via the form on the Contact us page.

    Risk Warning: Trading Derivatives carries a high level of risk to your capital and you should only trade with money you can afford to lose. Trading Derivatives may not be suitable for all investors, so please ensure that you fully understand the risks involved and seek independent advice if necessary. A Product Disclosure Statement (PDS) should be considered before entering into a transaction with us.

    The contents of this page are general information only and does not take into account your personal situation, financial objectives or needs. It is up to you to make sure the products that we offer suit your specific needs. You should not trade with us unless you understand the features and risks of the products that we offer. This means that you might need to seek independent advice before you start trading with us.

    © 2022 Raw Trading Ltd | All rights reserved.
    • Sample Page